Introduction
In this lab, you will send data from a single sensor connected to an Arduino analog input to a Processing sketch on a personal computer using asynchronous serial communication. The Processing sketch will graph the sensor’s value on screen. Graphing a sensor’s value like this is a useful way to get a sense of its behavior.
What You Will Need to Know
To get the most out of this Lab, you should be familiar with how to program an Arduino and with the basics of doing serial communication on the Arduino. If you’re not, review the links below:
Arduino Programming Basics
Arduino Analog Input
Introduction to Asynchronous Serial Communication
Items You will Need
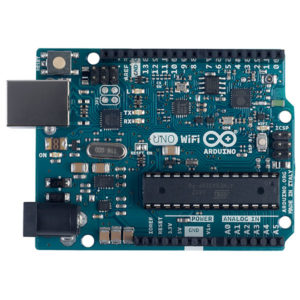
Arduino microcontroller 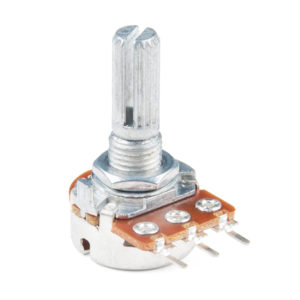
Potentiometer 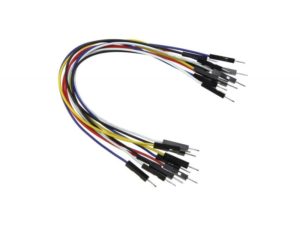
Jumper wires
Graphing Sensor Data
Steps and observations:
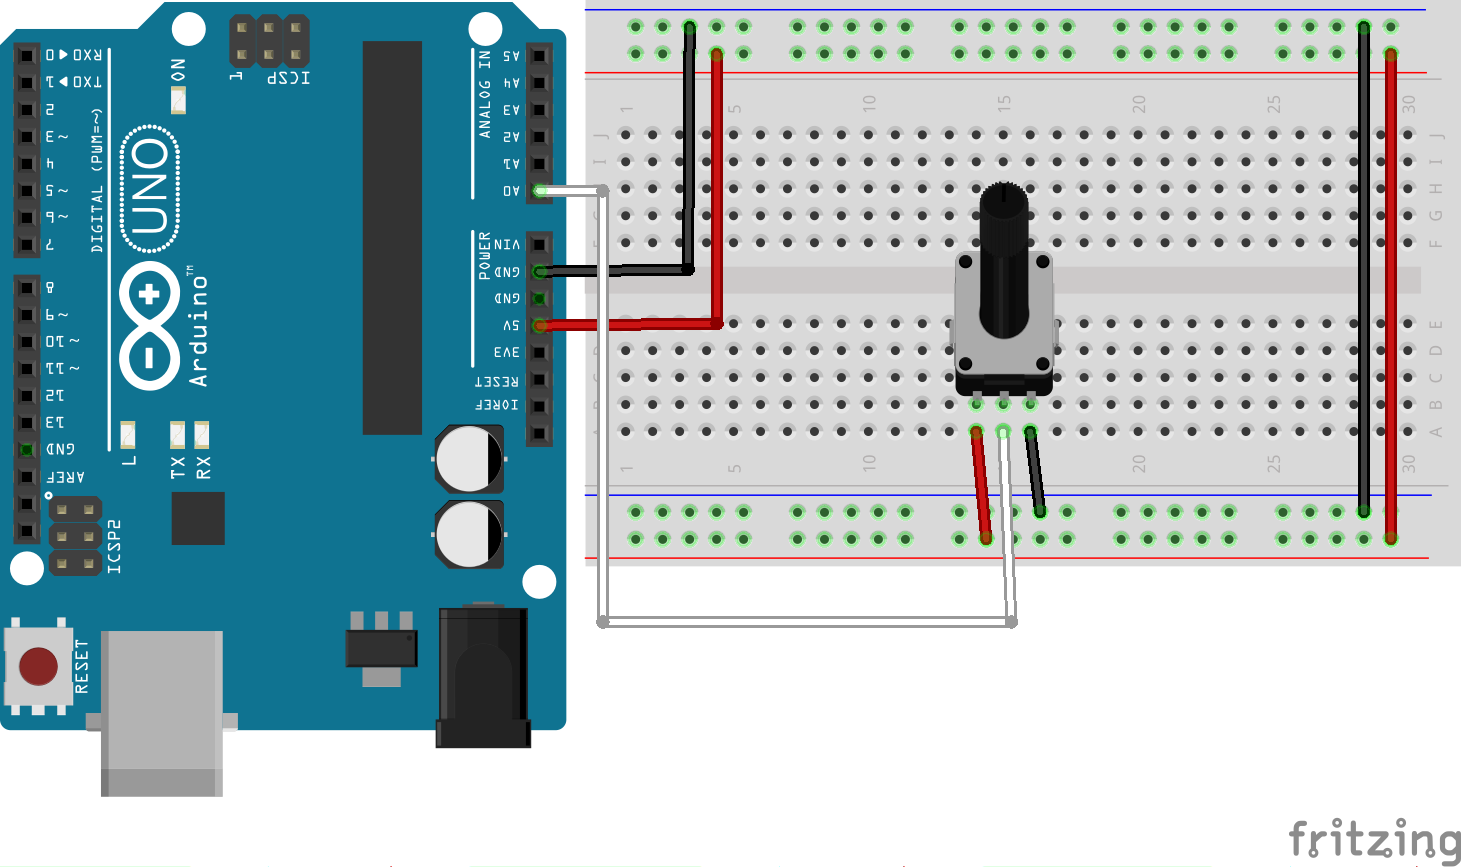
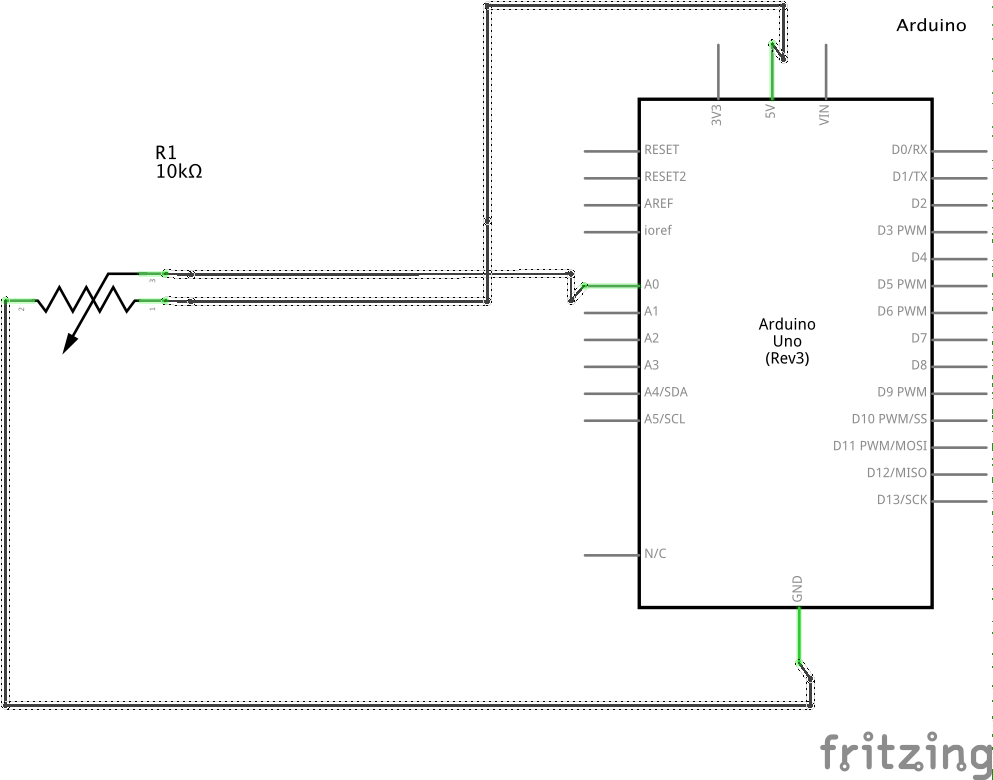
- Connect your analog sensor to analog pin 0. A potentiometer is shown below but you can use any sensor you like as long it produces an analog signal.
- In your Arduino IDE open the example file under File > Examples > 01.Basics > AnalogReadSerial and upload it to your Arduino board
- Open this file in Processing or copy and past the below (make sure to change the index in the
Serial.list()array if necessary) - Run the sketch and observe the graph as you turn the knob on your potentiometer (or affect you sensor)
/*
 * SensorGraphASCII
 *
 * Carlos Castellanos
 * June 23, 2020
 *
 * Example of serial communication between Processing & Arduino
 * Arduino sends the data as ASCII and Processing graphs the data
 *
 *
 *
 */


import processing.serial.*;

Serial myPort; // Serial object

float xPos = 0; // horizontal position of the graph
float yPos = 0; // vertical position of the graph

// Data received from the serial port
int val;
String inBuffer;

void setup() {
  size(1000, 1000); // window size

  // List all the available serial ports
  println(Serial.list());
  // change the number below to match your port
  String portName = Serial.list()[1];
  // create a serial object
  myPort = new Serial(this, portName, 9600);
  // empty the serial buffer
  myPort.clear();
  // don't generate a serialEvent() until you get a newline character
  myPort.bufferUntil('\n');

  // set the background color
  background(#110239);
}

void draw() {
  // Change yPos based on the last byte you read from the serial port:
  // To draw a graph with the numbers you read, pick a point whose distance
  // from the bottom of the window corresponds to the number's value.
  // In other words, the variable yPos (corresponding to the vertical position)
  // must equal the window height minus the number's value (yPos = height - val).
  yPos = height - val;

  // draw the line
  stroke(#cccccc);
  line(xPos, height, xPos, yPos);

  // at the edge of the screen, go back to the beginning:
  if (xPos >= width) {
    xPos = 0;
    // clear the screen by resetting the background:
    background(#110239);
  } else {
    // increment the horizontal position for the next reading:
    xPos++;
  }
}

void serialEvent(Serial s) {
  // get the string
  // Note: Every time you read a char, byte or string, it’s removed from
  // the serial buffer. So it’s good practice to read the string into a
  // variable as shown below and immediately do something with that data
  // (like graph it, which we do in the draw() method). Then read another string.
  String inBuffer = s.readStringUntil('\n');

  if (inBuffer != null) {
    inBuffer = trim(inBuffer); // remove any possible white space characters
    val = int(inBuffer); // get the latest string char & convert it to an int
    println(val); // print it
  }
}
- Now change the Arduino code to send raw binary data
- Open this file in Processing or copy and past the below (again make sure to change the index in the
Serial.list()array if necessary) - Run the sketch and observe the graph as you turn the knob on your potentiometer (or affect you sensor)
/*
 * SensorGraph
 *
 * Carlos Castellanos
 * June 23, 2020
 *
 * Example of serial communication between Processing & Arduino
 * Arduino sends one byte and Processing graphs the data
 *
 *
 *
 */

import processing.serial.*;

Serial myPort; // Serial object

float xPos = 0; // horizontal position of the graph
float yPos = 0; // vertical position of the graph

// Data received from the serial port
int val;

void setup() {
  size(1000, 1000); // window size

  // List all the available serial ports
  println(Serial.list());
  // change the number below to match your port
  String portName = Serial.list()[4];
  myPort = new Serial(this, portName, 9600);
  myPort.clear(); // empty the serial buffer

  // set the background color
  background(#110239);
}

void draw() {
  // Change yPos based on the last byte you read from the serial port:
  // To draw a graph with the bytes you read, pick a point whose distance
  // from the bottom of the window corresponds to the byte's value.
  // In other words, the variable yPos (corresponding to the vertical position)
  // must equal the window height minus the byte's value (yPos = height - val).
  yPos = height - val;

  // Now we set the stroke color and draw a line at xPos (the horizontal position)
  // from the bottom of the screen to the vertical position you calculated in the
  // serialEvent() method.

  // draw the line
  stroke(#cccccc);
  line(xPos, height, xPos, yPos);

  // at the edge of the screen, go back to the beginning:
  if (xPos >= width) {
    xPos = 0;
    // clear the screen by resetting the background:
    background(#110239);
  } else {
    // increment the horizontal position for the next reading:
    xPos++;
  }
}

void serialEvent (Serial myPort) {
  // get the byte
  // Note: Every time you read a byte, it’s removed from the serial buffer.
  // So it’s good practice to read the byte into a variable as shown below
  // and immediately do something with that byte
  // (like graph it, which we do in the draw() method). Then read another byte.
  val = myPort.read();
  // print it:
  println(val);
}
You should see the sensor’s value graphed on the screen, like so:
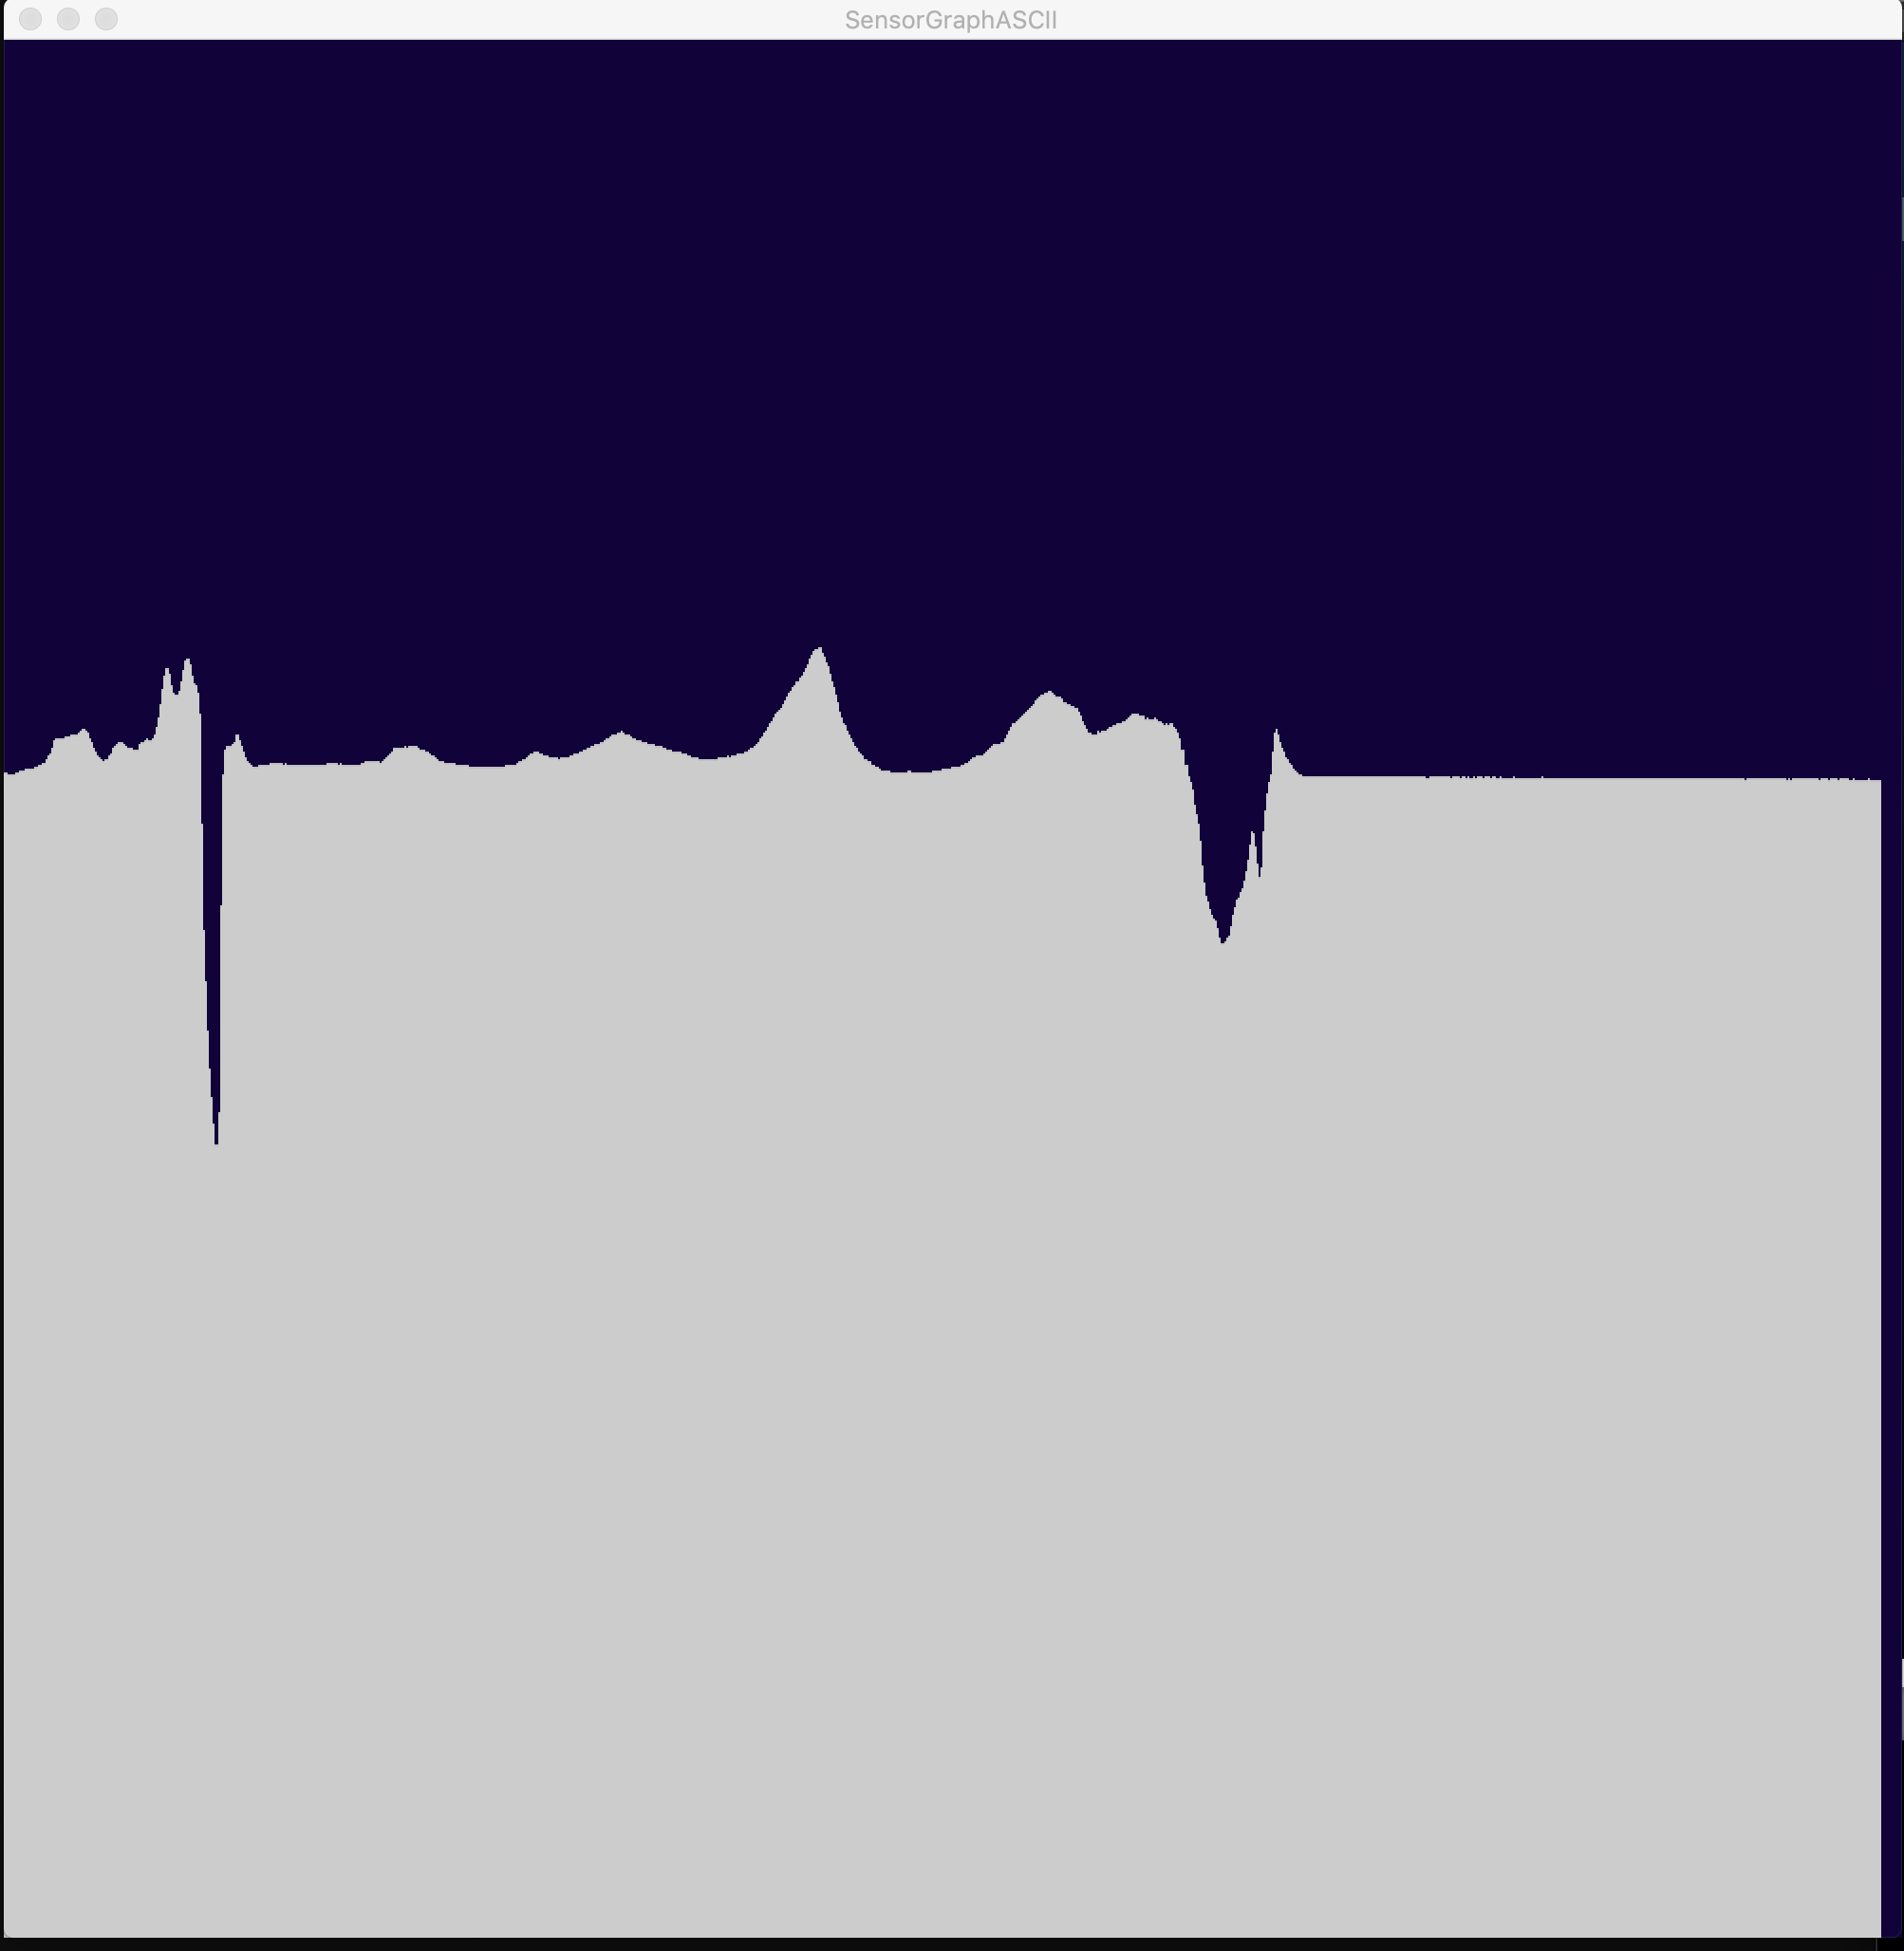
Notes:
Viewing the sensor data in this way helps fix any bugs and inconsistencies easier. It is also useful in you need to adapt your system to the sensor’s behavior (or alter the sensor’s behavior).